Welcome to the second part of our 2018 Voter Services Report! This post delves into the state of our local democracy as measured by voter engagement in Northfield. All election data graphically presented in this post were collected from the Office of the Minnesota Secretary of State. While we cannot conclusively isolate and identify the effect our League’s voter service efforts had on voter turnout in our community, the below analysis reveals Northfield voters were extremely engaged and active in the 2018 midterm election. As a League, we are honored and proud to have been a part of the activation process that produced these strong levels of civic engagement.
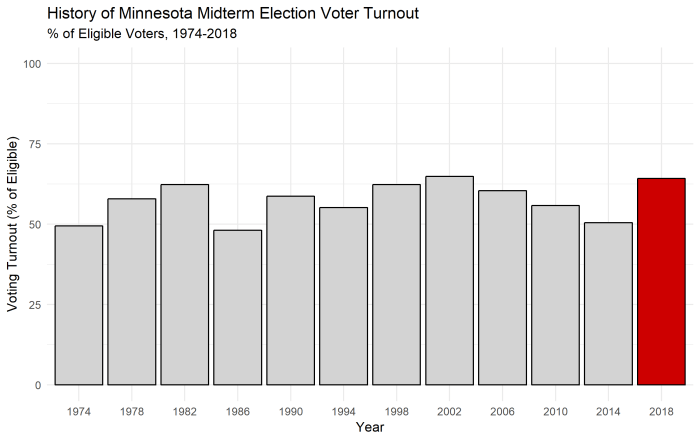
Before delving into our local case, it is important to note that Minnesotans across the state were very energized in the 2018 election. Minnesota had the highest voter turnout in the nation. Figure 1 presents the recent history of turnout in Minnesota. The 2018 Minnesota election turnout is comparable to the 2002 election with 2,611,365, or 64% of all eligible voters, casting a vote. Compared to the turnout rate of 50% for the national voting-eligible population (as reported by the United States Election Project), Minnesotans were quite active in the 2018 midterm election.
To investigate Northfield’s voter registration and turnout rates, voting data was aggregated for all precincts in Northfield’s Ward 1, Ward 2, Ward 3, Ward 4, and the Northfield Township. The 2010 Census estimates 17,179 voting-eligible individuals, 18 years of age and over, live in this geographical area. In 2018, 10,824 individuals, or 63% of the eligible voting population in Northfield voted in the general election. This figure closely aligns with the average statewide voting rates.
While it is useful to see that Northfield had a healthy, average level of turnout in 2018, a more comprehensive analysis of voter registration and turnout in Northfield can help us identify whether the 2018 turnout levels were unusual for Northfield. Figure 2 presents the raw voting registration numbers in Northfield. Northfield’s changing population (for example, Northfield’s adult population grew by 3,000 between the years 2000 and 2010) makes identifying trends from raw counts difficult, but in recent years, the numbers of voters registered has been quite level, especially in midterm elections. In 2018, 84% of the eligible voting population in Northfield was registered to vote either before or on Election Day. This rate is impressively high, especially when considering only 64% of the national voting age population was registered to vote in the 2014 midterm election.

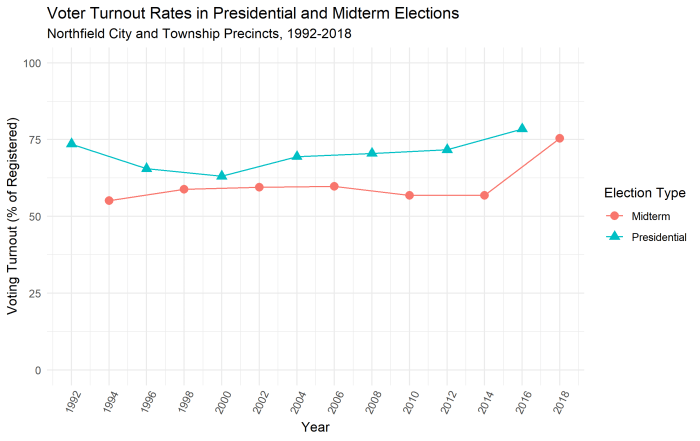
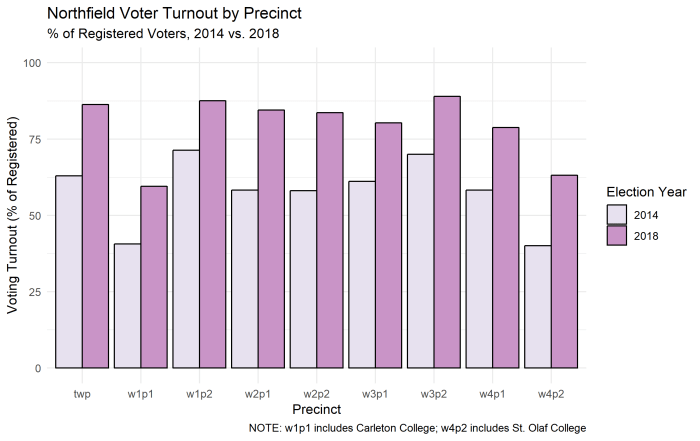
Finding precise estimates for local voting-eligible populations are difficult to procure, but we can get a sense of Northfield’s voting trends over time by calculating Northfield turnout as a percentage of registered voters. Figure 3 shows the percentage of registered voters in Northfield who cast a ballot in elections since 1992. As is predicted by differences in election interest and information, voter turnout rates tend to be lower in midterm elections than in presidential elections. However, the turnout rate in 2018 emerges as an anomaly in Northfield’s recent electoral history. Over 75% of registered voters in Northfield voted in the 2018 midterm election, a rate that is very comparable to the 2016 presidential voting turnout rate of 78%. Northfield experienced very robust levels of voter registration and participation in the 2018 election. Figure 4 shows this increase in turnout from 2014 to 2018 occurred consistently across all Northfield precincts.
While most studies of voter turnout only consider whether or not an individual cast a ballot, there are other ways to conceptualize voter turnout. When citizens are in the voting booth, they still have to choose whether or not to vote on a given issue or race. The phenomenon where people choose to vote for one issue/race, but not another is defined as “ballot roll-off.” The information theory of voting presented by Matsusaka (1995) argues that most people are predisposed to vote, but they will abstain when they are unable to evaluate the candidates. Consequently, ballot roll-off is more likely to occur in lower level elections where finding information on the issues and candidates takes more effort. Ballot roll-off is also more likely among populations that face higher informational costs.
College students are one of the groups more susceptible to ballot roll-off. As busy and often new members of a community, college students may not be as connected to local information sources. Faced with these obstacles, students at the polls often abstain from participating in local elections even though they are willing to vote for statewide and national offices. During 2018, our League worked closely with the two colleges located in Northfield, St. Olaf and Carleton, to help educate and activate students so they would feel empowered to vote in elections at all level of government. Voter education events and the respective digital recordings were widely publicized and shared on both campuses. St. Olaf and Carleton students were also actively recruited to participate in our various registration and education events. As a result of the efforts of our League and campus civic engagement centers, we are excited to report a clear reduction in voter roll-off during the 2018 election. Figure 5 presents ballot roll-off rates for three precincts in Northfield for the 2014, 2016, and 2018 general elections.
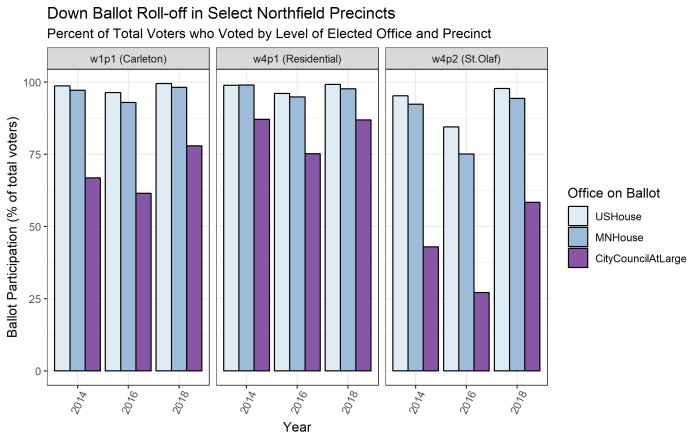
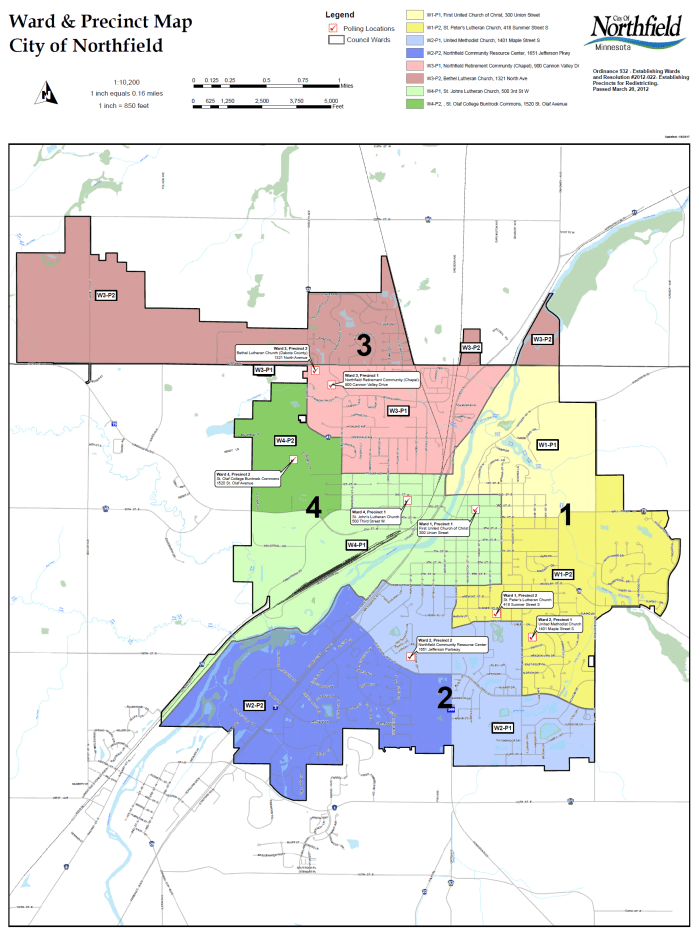
The three precincts displayed in Figure 5 enable us to examine whether or not college students exhibit greater rates of ballot roll-off rates than other Northfield citizens and whether roll-off rates were reduced in the 2018 election. As a mostly residential area, Ward 4-Precinct 1 (w4p1) was selected as a reference point to help better analyze the voting roll-off in precincts, Ward 1- Precinct 1 (w1p1) and Ward 4- Precinct 2 (w4p2) , that have a high percentage of students. W1-P2 contains most Carleton students, but this precinct also encompasses several residential blocks. W4-P2 also contains some residential neighborhoods, but the majority of its voters come from the St. Olaf student body. Figure 6 presents the current ward and precinct map boundaries for the City of Northfield.
Voters in the three sampled precincts voted at relatively high levels in all of the elections for U.S. House Representative (Congressional District 2) and Minnesota State Legislative Representative (District 20B). For the most part, over 95% of voters in all precincts in the 2014, 2016, and 2018 general elections voted for U.S. House candidates. The few exceptions to this high rate of federal-level election participation occurred in the presidential election year. For example in the St. Olaf precinct during the 2016 election, only 84% of the voters cast a vote in the U.S. House election. The higher level of federal level roll-off in 2016 was probably caused by individuals who were only interested in voting for the presidential election candidate.
Ballot roll-off is also seen in statewide elections as fewer people voted for Minnesota State Legislature representatives across all precincts in all years. However, the most dramatic roll-off is seen in votes cast for At-large members of the Northfield City Council. In the residential W4-P1, only 86% of the precinct’s voters chose to vote for the 2018 At-large city council member.
Looking at all precincts and electoral years, it is clear the college precincts experience greater ballot roll-off for local elections compared to the more residential precinct. However, in a comparison of the two midterm elections, 2014 and 2018, the college precincts’ local vote participation is visibly higher in the 2018 election. While there was no real difference in ballot roll-off between 2014 and 2018 for voters in the residential precinct (w4p1), 11% more voters in the Carleton precinct (w1p1) and 15% more voters in the St. Olaf precinct (w4p2) voted in the 2018 Northfield City Council election. We are confident our League activities and college civic engagement center efforts helped improve student participation in local elections, but it is impossible to isolate how much our specific voter service efforts improved local election turnout in the college precincts. It is possible that unrelated shifts in election salience, candidate mobilization efforts, and outreach from other community groups contributed the turnout increases. While we cannot control for alternative explanations in our analysis, the improvements in participation rates following the 2018 efforts are still heartening.
Analyzing a wide range of voter turnout data, this report presents a generally positive picture of the state of democracy in Northfield, although there is always room for improvement. The League will continue to assist community members navigate the electoral arena and empower and inspire citizens to participate in elections at all levels. If you would like to help increase political participation in Northfield or have ideas on how to improve our local democratic participation, send us an email at contactus@lwvnorthfieldmn.org.